CentOS部署Prometheus监控

Prometheus是一套开源的系统监控报警框架。Prometheus作为新一代的云原生监控系统,相比传统监控监控系统(Nagios或者Zabbix)拥有众多有点。
下载安装启动exporte
[root@localhost ~]# wget https://github.com/prometheus/node_exporter/releases/download/v0.18.1/node_exporter-0.18.1.linux-amd64.tar.gz
[root@localhost ~]# tar zxf node_exporter-0.18.1.linux-amd64.tar.gz
[root@localhost ~]# mv node_exporter-0.18.1.linux-amd64 /usr/local/node_exporte
[root@localhost ~]# /usr/local/node_exporte/node_exporter &
下载安装Prometheus
[root@localhost ~]# wget https://github.com/prometheus/prometheus/releases/download/v2.10.0/prometheus-2.10.0.linux-amd64.tar.gz
[root@localhost ~]# tar -zxf prometheus-2.10.0.linux-amd64.tar.gz
[root@localhost ~]# mv prometheus-2.10.0.linux-amd64 /usr/local/prometheus
配置Prometheus
[root@localhost ~]# vim /usr/local/prometheus/prometheus.yml
# 修改如下
  - job_name: 'node'
    static_configs:
    - targets: ['localhost:9100']
启动Prometheus
[root@localhost ~]# /usr/local/prometheus/prometheus --config.file=/usr/local/prometheus/prometheus.yml &安装Grafana
[root@localhost ~]# wget https://dl.grafana.com/oss/release/grafana-5.4.2-1.x86_64.rpm
[root@localhost ~]# yum -y install initscripts urw-fonts
[root@localhost ~]# rpm -Uvh grafana-5.4.2-1.x86_64.rpm
启动Grafana
[root@localhost ~]# systemctl start grafana-serverGrafana页面配置
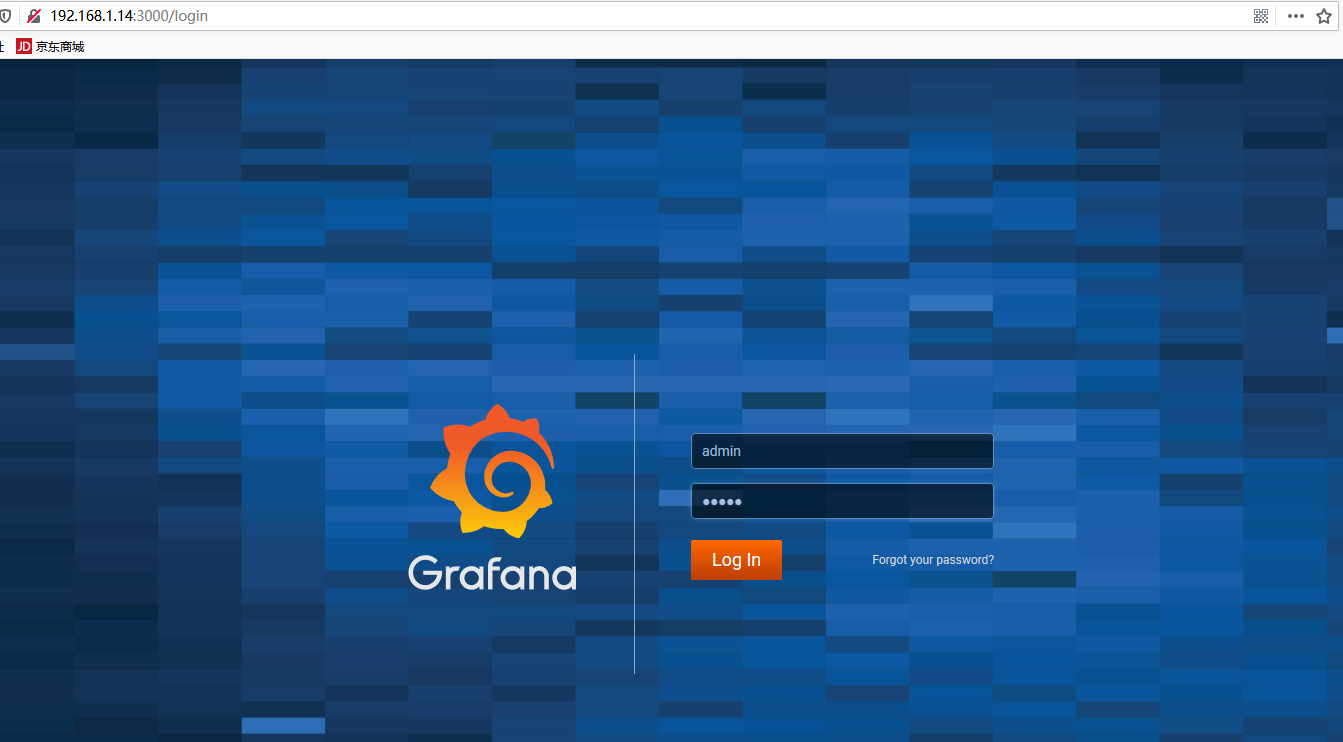
访问http://192.168.1.14:3000
默认用户密码都是admin
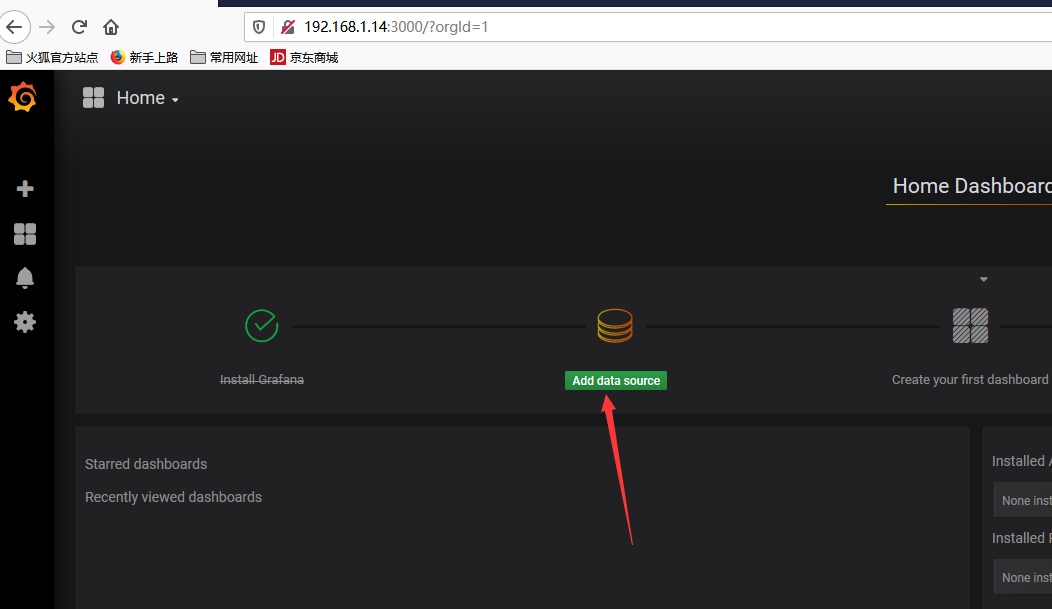
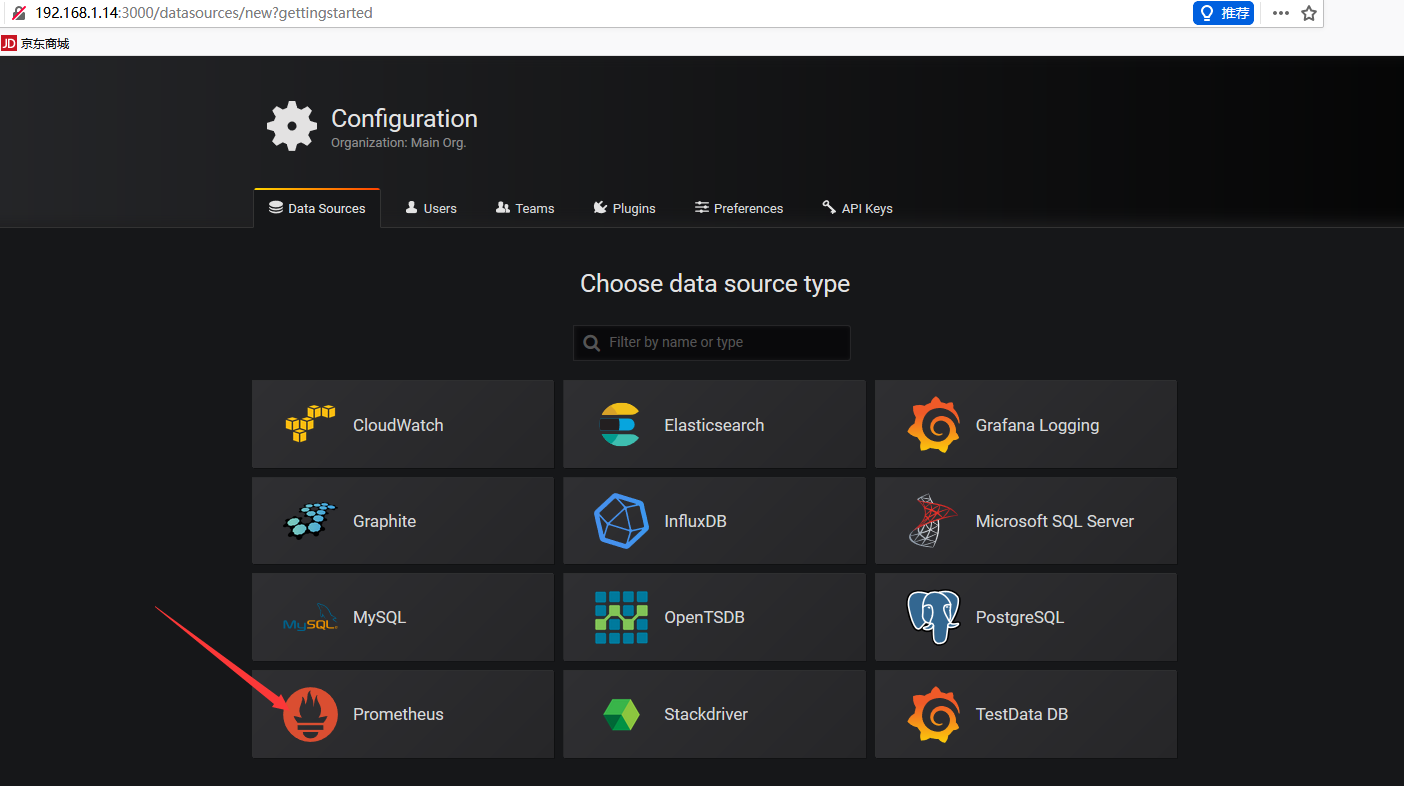
创建展示界面监控数据源
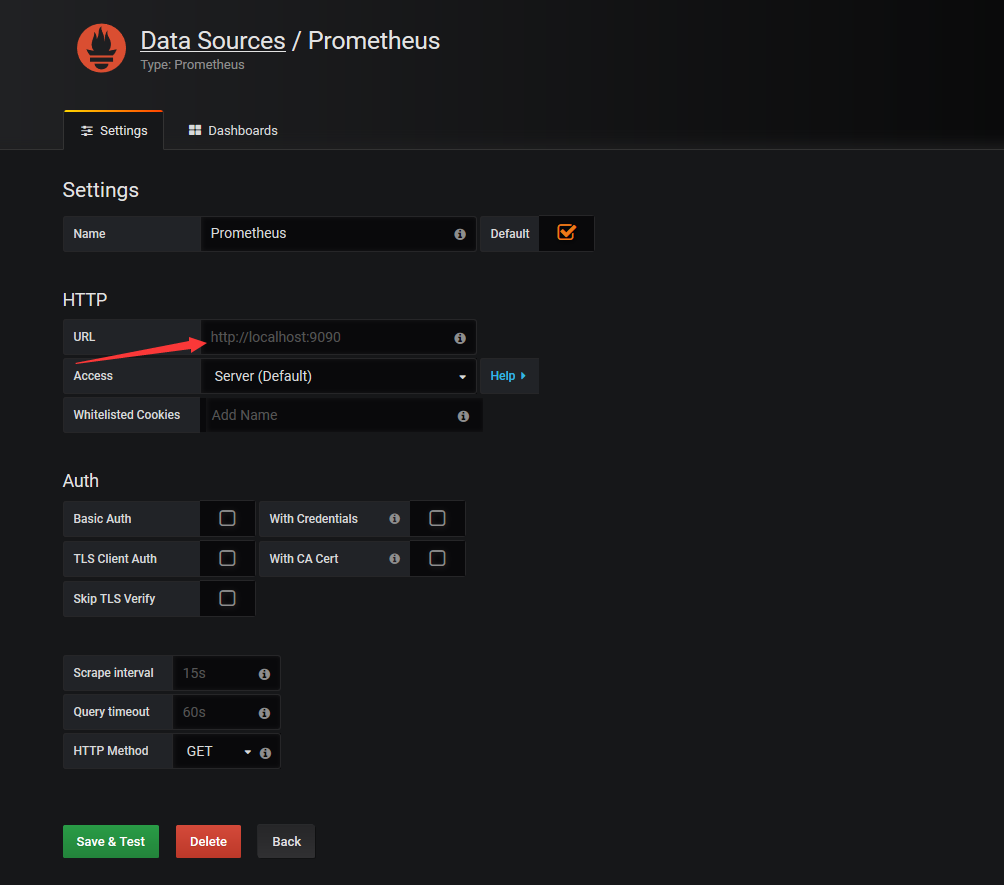
选择Prometheus
Prometheus所在主机的服务端口
添加仪表盘
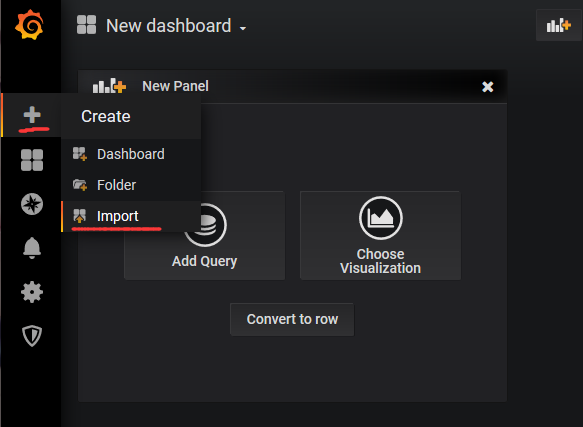
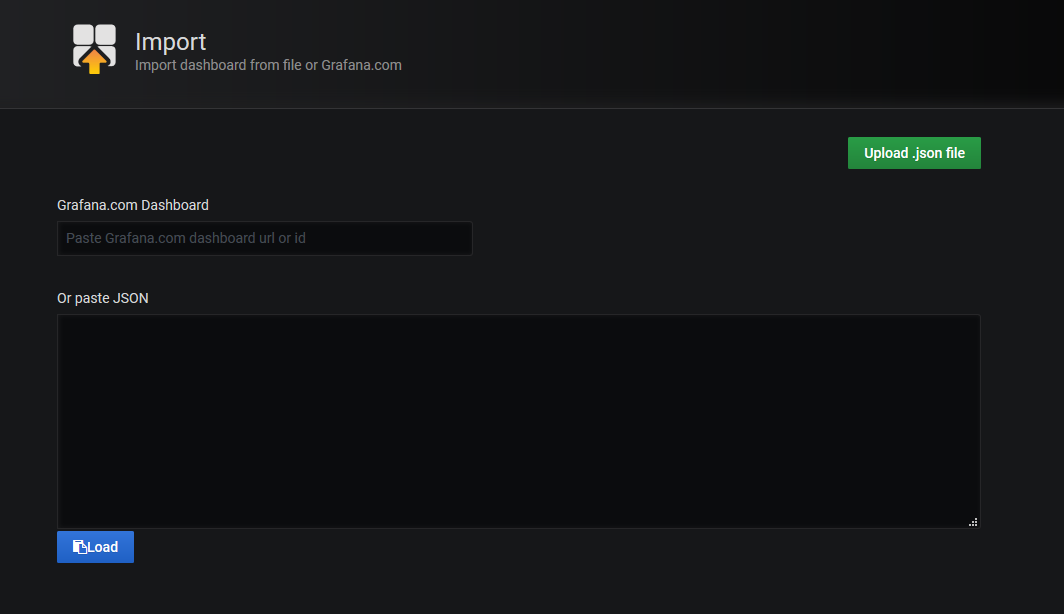
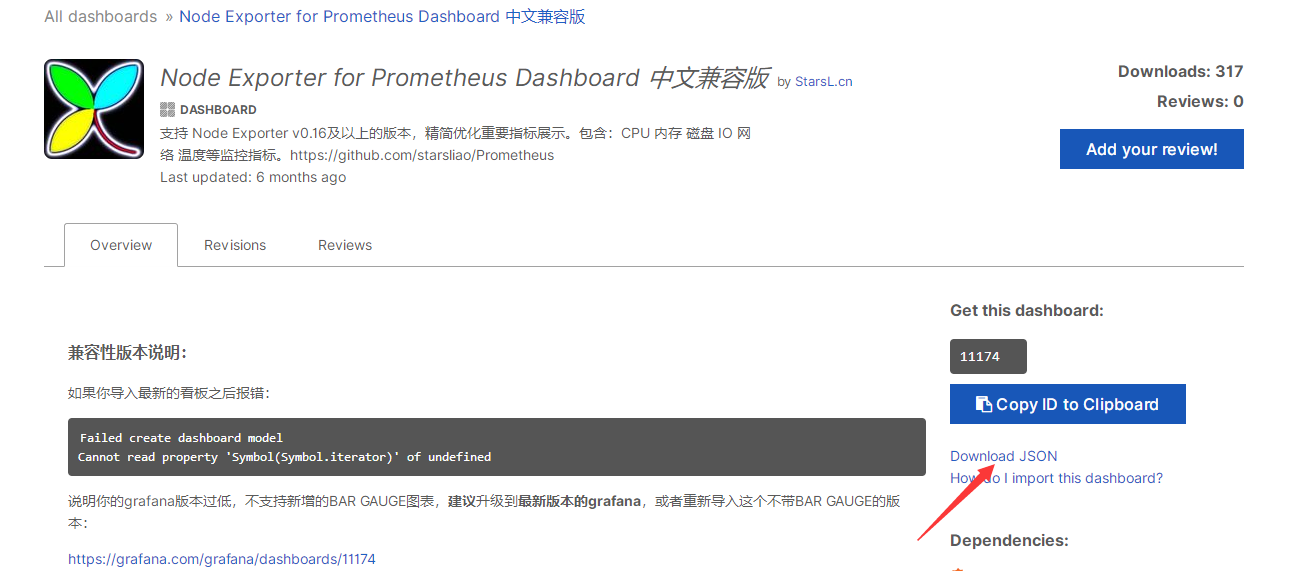
上图中的空白处需要添加一个json文件,需要从grafana的官网进行下载,这里可以选择关于Docker的仪表盘,很多种类,这里以官方使用的为主,点击这里使用接下里要用的dashboard,进入页面后,如图所示,根据图中红线处即可下载
然后将文件导入Grafana页面即可,选择数据源为Prometheus
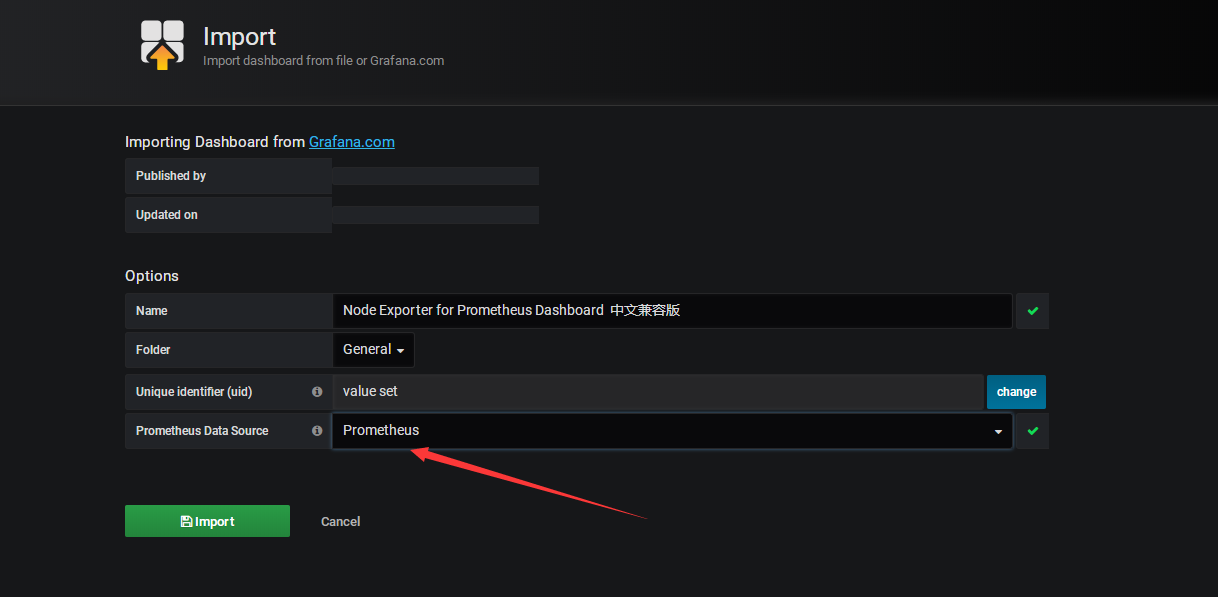
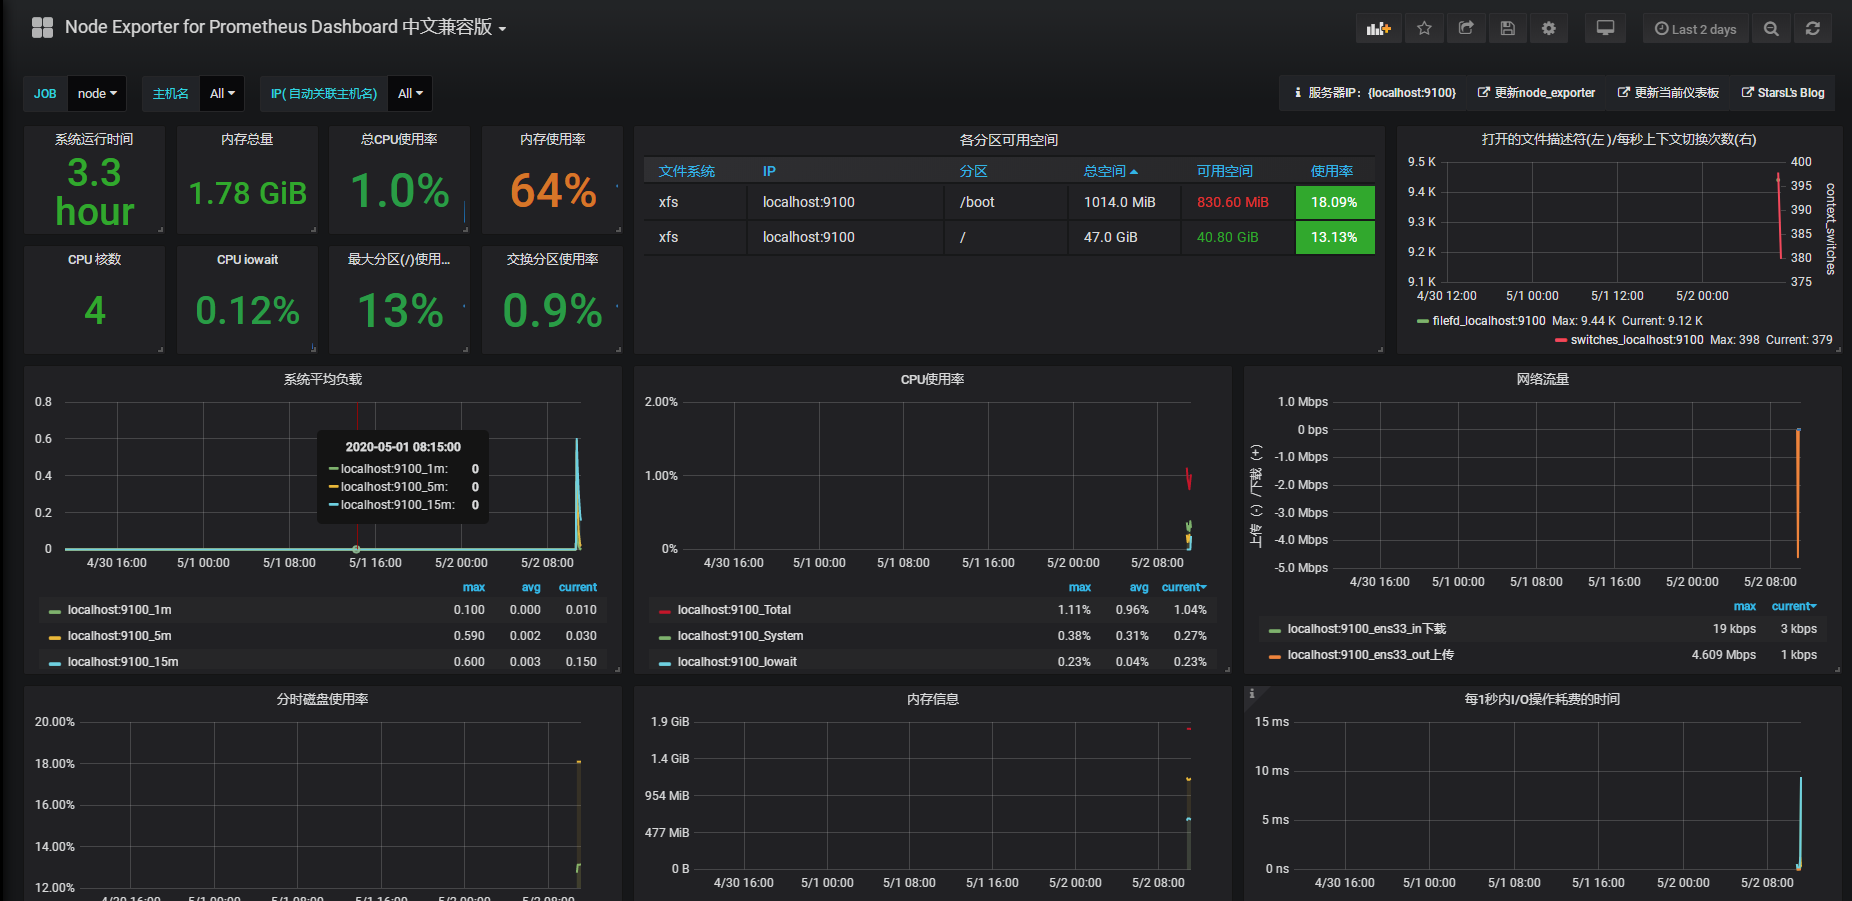
成功~
博客内容遵循 署名-非商业性使用-相同方式共享 4.0 国际 (CC BY-NC-SA 4.0) 协议
本文永久链接是:https://www.feiyiblog.com/2020/05/03/CentOS%E9%83%A8%E7%BD%B2Prometheus%E7%9B%91%E6%8E%A7/